Domino's vs Pizza Hut: The Geospatial Pizza War in Bangalore
Pizza: A Global Phenomenon
Pizza🍕, the beloved dish originating from Italy, has become a global sensation, enjoyed by millions across the world. The global pizza market is valued at over $178 billion, with billions of pizzas consumed every year.[1] In India, the pizza market was valued at approximately $1.5 billion in 2021, with Bangalore being a significant contributor to this growth.[2]
Domino's , known for its fast delivery and innovative technology, operates in over 90 countries with more than 17,000 stores worldwide. Pizza Hut , a pioneer in the pizza business, boasts over 18,000 restaurants in 100 countries, offering a diverse menu that appeals to a wide audience.
These two titans not only dominate the pizza landscape globally but also have a massive presence in India, particularly in Bangalore, where the competition is as hot as the ovens baking their pizzas.
The Battle of the Giants
Get ready for a slice of the action in Bangalore, where Domino's and Pizza Hut are locked in a heated battle for pizza supremacy. With 87 Domino's stores and 81 Pizza Hut outlets catering to a vibrant population of 8,443,422 (based on the 2011 census), the rivalry is intense. But who's really coming out on top? I’ve dug into the data, mapped out the store locations, and analyzed where these pizza giants should expand next. While the population figures are from 2011, I’ve have considered consistent population growth would occur,so only the numbers will increase but the percentages would remain same,the overall analysis will be done on 2011 census data only.
Data Collection
To gather the necessary data for this analysis, I employed a combination of web scraping, geocoding, and publicly available data. For Domino's, I scraped their store locator to retrieve the addresses of all 87 stores in Bangalore. After collecting the addresses, I used the Google Geocoder to obtain the precise latitude and longitude for each location.
For Pizza Hut, the process was a bit simpler. I accessed their website, which conveniently provided the latitude and longitude for each of the 81 stores directly. This streamlined the data collection process and ensured accuracy in the geographical mapping.
The population data, including ward-wise details, was sourced from government data websites. This data was readily available and provided critical insights into the distribution of the population across different wards in Bangalore.
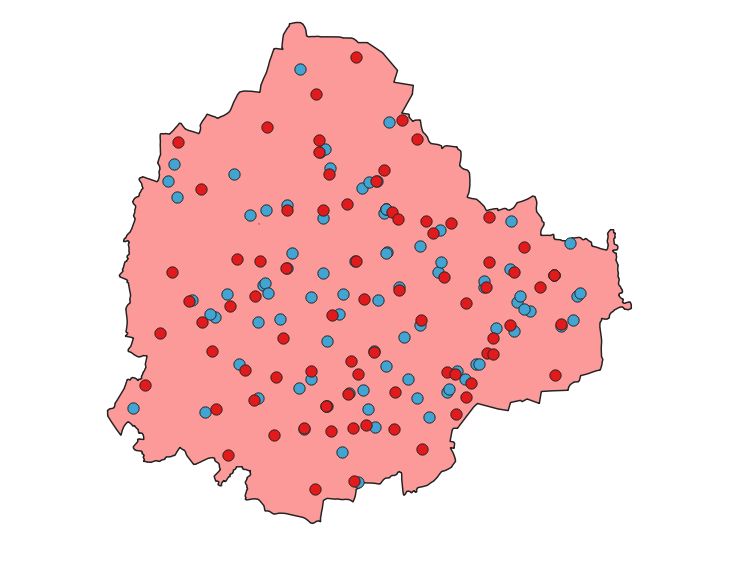
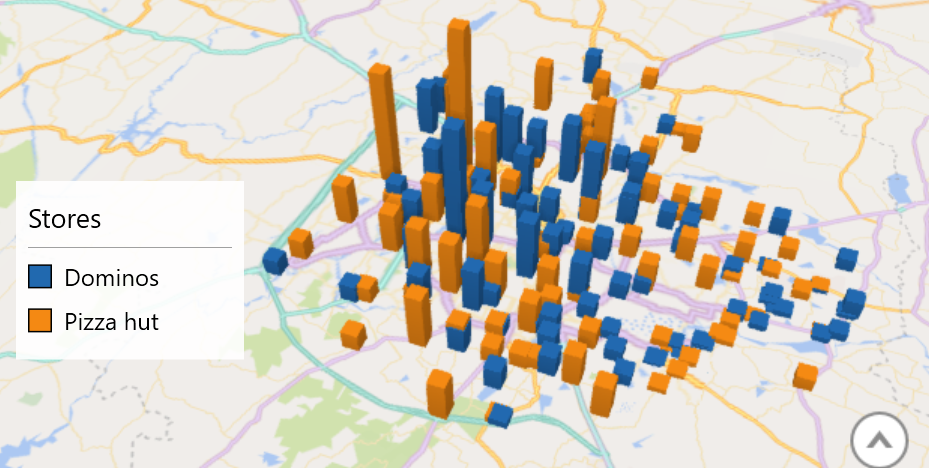
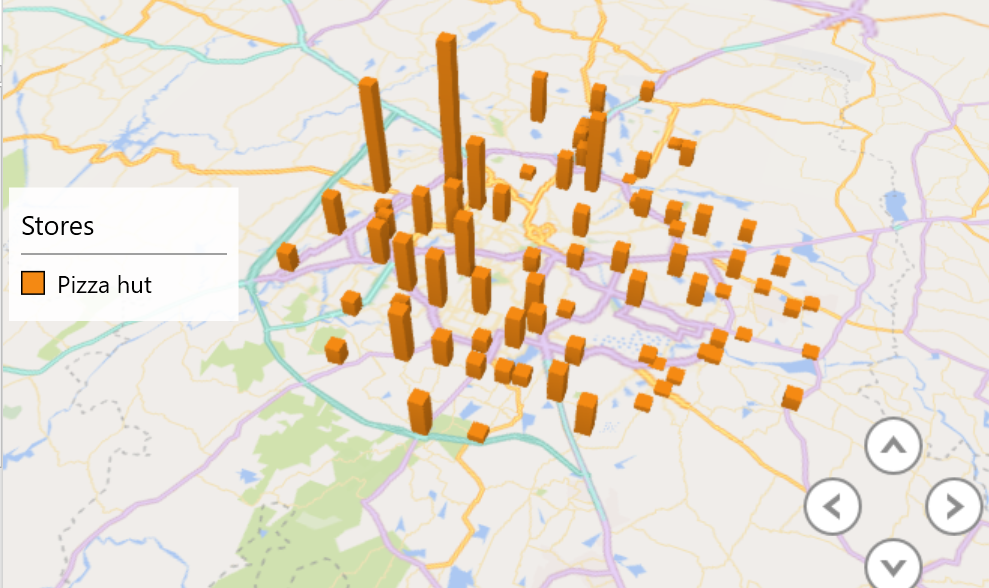
Stores • Dominos • Pizza hut
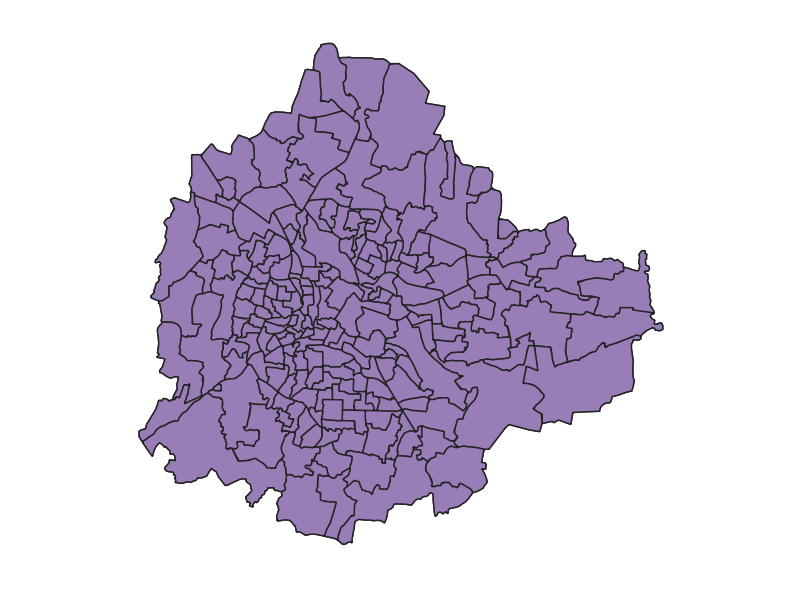
Bengaluru Wards
Voronoi Polygons: Defining Service Areas
To understand how each Domino's and Pizza Hut store serves its surrounding area, I utilized Voronoi polygons. This method divides the map into regions, with each region assigned to the closest store. The result? A clear visual representation of the geographical reach of each outlet, ensuring that every store's service area is well-defined and optimized for delivery.
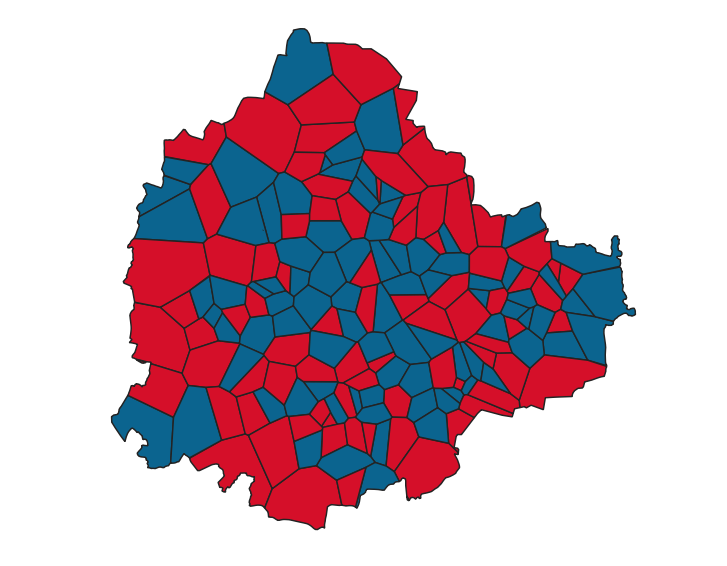
Closest Store Distribution
Estimating Population Served
To calculate the population served by each store, I assumed that the population was uniformly distributed across each ward. By combining this assumption with the Voronoi polygons, I was able to estimate how many people each Domino's and Pizza Hut outlet serves. This method provided a practical approach to understanding the market reach of each store within Bangalore.
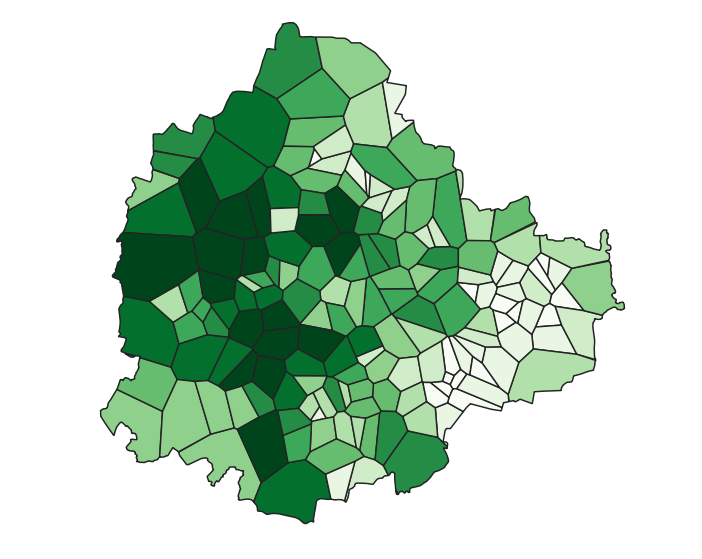
Population heatmap
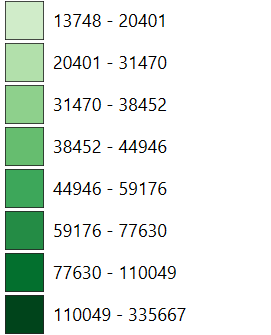
Legend
Estimating Store Reach
By combining the service areas defined by Voronoi polygons with population density data, I estimated how many people each Domino's and Pizza Hut store serves in its respective area. This comprehensive analysis provided insights into the market reach and potential gaps in service coverage. This video shows the reach of dominos and pizza hut around thier stores
Estimated Store Reach Video
The pie chart sums up the fierce competition between the two giants, it also shows how well the stores are placed in the city to have almost equal reach, but still there is some scope of improvement for both the brands.
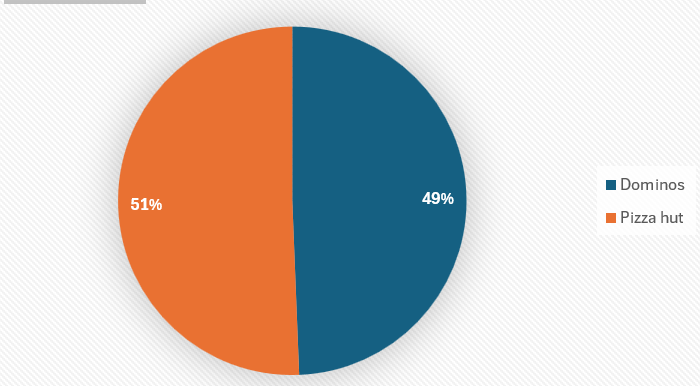
Store Reach
Analysis
General Analysis
The detailed geospatial analysis provides a comprehensive view of the competitive landscape between Domino's and Pizza Hut in Bangalore.
As seen from the maps , the heartland of banglore or the middle part of the city is captured mainly by domino's whereas the outer or boundary of the city is covered more by pizza hut
Domino's: Weak Zones and areas for improvment
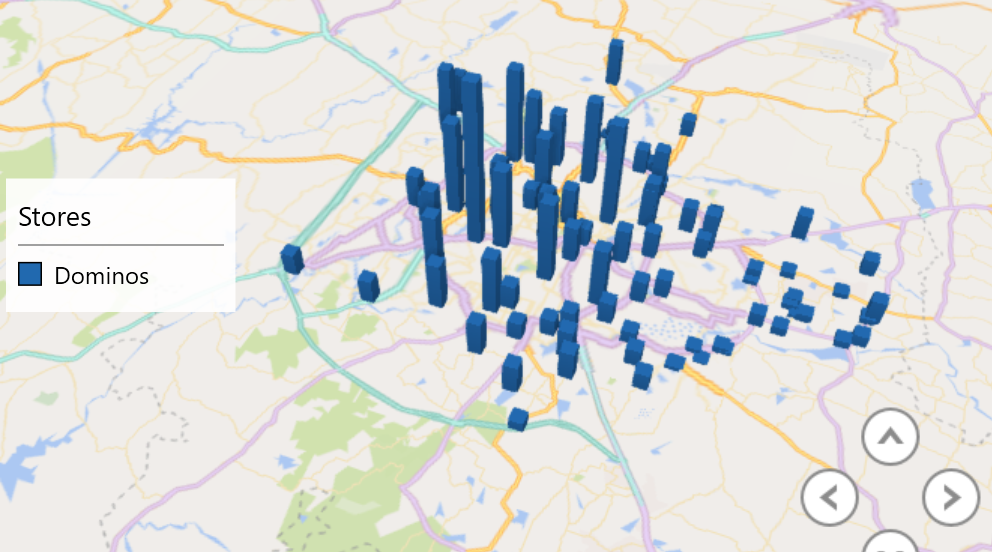
Domino's is performing well in the central parts of Bangalore , where a high concentration of stores caters to a substantial customer base. However, there are opportunities for growth in the west part of the city, which has a higher population density but fewer stores. Additionally, expanding to the outskirts except eastern part and boundary areas of Bangalore could help Domino's tap into new customer segments and further increase business reach.
Pizza Hut: Weak Zones and areas for improvement
Pizza Hut performs well in the western parts of Bangalore and on the city's boundaries. However, the brand needs to focus on improving store quality in the eastern regions and consider closing some redundant stores that serve very low populations. This could reduce operational costs and reallocate resources more effectively. Additionally, opening a few large stores in the central part of the city could boost market presence and customer reach.
Conclusion
The analysis reveals critical insights into the market dynamics of Domino's and Pizza Hut in Bangalore. While both brands have established strong presences, there are clear opportunities for improvement. Domino's can enhance its market coverage by expanding into high-density and boundary areas, while Pizza Hut should focus on optimizing store quality and strategically positioning new stores in central locations. Addressing these areas can lead to increased customer reach and operational efficiency for both brands.
Further Details
Colab notebook used for this project here: Colab Notebook.
Tools & Technologies used in this project include :
- Python: For data analysis, processing, and scripting.
- QGIS: For geospatial analysis and mapping.
- Excel: For organizing and refining data.
- Google Maps API: For geocoding store locations.
- Pandas: For data manipulation and analysis.
- GeoPandas: For handling geospatial data and operations.
A Special Thanks 🙏🏻 to Anand S Sir for teaching us passionately at Tools in Data science course at IIT Madras BS degree